LED datasheets can be quite difficult to interpret as some of the data might not seem to match the part number structure on a one-to-one basis. There are some technical aspects that also seem to confuse those who are new to RGBW lights. I will go through a datasheet that has a decent layout for the part number structure to try to give my best interpretation. I will also briefly review aspects of LED binning and common misconceptions about values found in the datasheet.
OSRAM USA Part Number Example
LED part numbers are notorious for being quite long, but that is only because they try to describe as much information as possible concerning LED characteristics. The example we will be looking is DigiKey part number 475-GWJ9LHS2.4M-C0C7-2+35+13+30AW-1-100-R18CT-ND (manufacturer part number GW J9LHS2.4M-C0C7-2+35+13+30AW-1-100-R18). Personally, the datasheet is structured quite clearly. It does take some amount of interpretation to figure how the values tie to the part structure, though. I will provide a step-by-step approach to the structure depicted below.

Product Name
The product name in the part number is GW J9LHS2.4M. There aren’t any specifications tied to this value.
Brightness Bins
The part number records C0C7. I think this is most likely describing the information found on page 7 of the datasheet. My best guess is that it is specifically calling out the blue and green brightness bins. I am not 100% confident why the red and white codes aren’t listed in the part number. My best guess is they are already saving room on an already long part number. The DigiKey product display page lists the center value for all mcd values. I will talk about this in more detail later on in this post for more context.
Red, Green, and Blue Bins
The part number records 2 in the red bin slot. This information is most likely referring to the red, green, and blue wavelength bins described on page 9. In this case, the value does match the only value listed.
The green bin portion of the part records 35. Personally, I think this means that it can range from T3 to T5. It’s not an exact match, but these wavelengths are pretty close together.
The blue bin portion of the part records 13. Again, I think this is describing the total range from B1 to B3.
White CCT
The part number records 30AW. The information on this specification is found on page 10. While none of the regions explicitly list 30AW, I think the value must fall around the oval labeled 30W3. I interpret it this way because no other chromaticity bin contains the same starting characters of 30A.
One Forward Voltage Group
The last value listed is 1. This information is found on page 8. This is the simplest specification to understand as the colors only list one range each.
The rest of the part number is most likely packaging information or internal to the manufacturer as it isn’t documented in the datasheet. Now that we’ve broken down the part number, let’s look at an example of how manufacturers categorize LED performance through binning.
Overview of LED Binning
At first glance, it may seem some of the ranges in the datasheet are quite broad. The values are listed like this for a reason, though. Think of these different LED bins as sub-ranges that are typical for each manufactured part. Making these tiny lights is not a simple process. Each color die needs to fit on a small surface area. These bins are describing tolerances for each specification. Keep in mind these are designed with vision in mind. Vision is logarithmic according to this article. Let’s explore one specification to show that all bins are already tightly defined.
Color Brightness Bins
If you go back to page 7, you can see the range of each color’s relative brightness. Again, these values seem to spread across a broad range. I conducted a study by using two methods to show that these values are not too different in terms of brightness. You can convert the millicandela values into lumens by the formula below.
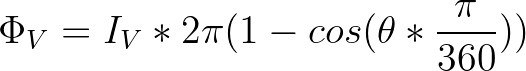
I found the equation here. This part has a 120° viewing angle, so I used that value for theta. Lumens are a bit easier to visualize than the directional millicandela rating. I found a decent representation of brightness for lumens here. The results on my attempt to visualize these differences are below. Please note, these are approximations and may not represent the actual expected brightness.
Method One Results
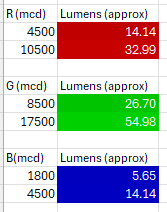
Since our eyes perceive light logarithmically, I thought I could use the information from that lumen chart to produce a fitted curve generated by Excel. I used the same 5 data points to help me plot a curve that had the closest R value. This helped me extrapolate data to produce a range of lumens from 1000 to 5. I used Excel’s conditional formatting to put a white to gray gradient over those values to show a reference for relative RGB color intensity. Once I had the grayscale equivalent, I used the darkest value of gray to give man approximation of how dim to set the RGB value for red, green, and blue. I will include the Excel file in the resource section at the bottom.
Method Two Results
I also wanted to generate visuals only using the data available in the datasheet. The previous method uses an external maximum luminosity value. This method uses a relative ratio comparing to the maximum brightness value in the datasheet. This ratio lets you establish a basis for using a natural logarithm.
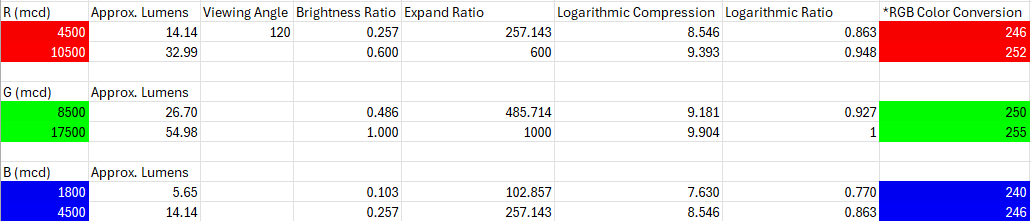
I did have to take the base ratio and multiply it by 1000 to make it large enough for a logarithmic scale. I just wanted to have a good approximation of how the human eye perceives light. I used the formula below to convert that to a log scale.
![]()
In order to convert that into an applicable RGB range of 0-255, the value must be between 0 and 1. I used the maximum brightness logarithmic value as the base line to convert it back. I found that a minimum RGB value of 190 is the closest intensity to 5 lumens based on method one. The conversion formula is 190 + (255-190) * Ratio. As you can tell, both methods have colors that look virtually identical in bright light. They will be more distinguishable in a dark setting; however, they are still going to be very difficult to tell apart between one LED and another. This is showing the worst-case scenario where the values are as far apart as they appear in the datasheet.
Conclusion
Hopefully this information helps you parse information found in other LED datasheets too. They aren’t formatted the same way, but the general patterns should still apply. LED bins are supposed to represent data that has been finely tuned, but the ranges may look broad without context. A big takeaway is that these graphs and datapoints are zoomed in which may skew perspective. Most applications will not require further calibration. Many assume it’s possible or feasible to obtain LEDs with very specific bins. If one does need tighter tolerances, it would be best to compare ranges across several parts rather than try requesting specific bins.
Excel Resource Sheet
colorComparison_nonVB.xlsx (41.8 KB)